
The knowledge of yourself will preserve you from vanity. - Miguel de Cervantes
I'll be the first to admit it: I'm as guilty as anyone on focusing on digital metrics that paint a pretty picture, instead of those that provide real, actionable knowledge.
It's an easy habit to fall into, especially when the knowledge to be gained may not necessarily be something your boss wants to hear.
But here's the good news: as digital marketers, we have access to a wealth of data about how prospects and customers are interacting with our digital spaces. If you can get bad data, you can get good data, too.
Are you measuring website analytics that provide the kind of knowledge that can inform business decisions, or do your web reports only serve you or your boss' vanity?
The list below might help you answer that question. And even if your "true" metrics don't paint as pretty of a picture as your vanity metrics did, at least you'll be armed to make the kind of decisions that can help your business in the long run.
Website Vanity Metrics
1. Number of Visits
One of the themes you'll see running through the vanity metrics I identify is quality over quantity.
No vanity metric exemplifies this theme more than counting and reporting the amount of people that visit your website in a given time period.
As you might've guessed, you're better off analyzing what those people do when they're using your site than merely tallying how many people use it.
Focus on these metrics instead:
- Average session duration (time on site)
- Number of website leads or sales
- Visit-to-lead or visit-to-sale conversion rate
Instead of focusing on the quantity of your website visits, these metrics give you an idea of their quality.
If you're not driving leads or sales with your website, measuring average session duration can tell you how engaged your visitors are.
If you are engaging an inbound marketing strategy, measuring leads/sales generated, or the percentage of visits that lead to a lead or sale (conversion rate) is the way to go.
If you're not currently generating leads or sales from your website but want to, check out our guide to SEO lead generation.
Key stat: 55% of all website visits last less than 15 seconds.
2. Page views
Shocker: what applies to your website as a whole also applies to individual web pages.
Instead of judging your pages by how many people visit them, take a deeper dive and see what they do when they get there.
Focus on these metrics instead:
- bounce rate
- time on page
- assisted conversions
Think of bounce rate, which is defined by Google itself as "the percentage of visitors to a particular website who navigate away from the site after viewing only one page," as your "first impression rate." It tells you if visitors who land on a given page find it useful enough to continue exploring your site.
One of my favorite metrics to report is assisted conversions, which tells you how many people who visited a given page went on to convert to a lead or sale.
Key stat: On average, mobile visitors bounce at a rate of 51%—higher than desktop visitors (43%).
Email Marketing Vanity Metrics
3. Opens/Open Rate
Measuring open rate does have value. It can help you learn how effective your subject line or sender line are.
Contrary to popular belief, that is about where the value stops.
Email marketing tools measure open rate by embedding code that downloads a tiny, invisible image within opened emails. When this image is downloaded and displayed in a user's email client, that email is recorded as being opened.
There are a few problems here.
If the recipient opens the email in a non-HTML email client, or one that allows users to download an HTML email without images, the image won't be downloaded, and the open is not recorded.
More importantly, it doesn't matter if the user actually read anything in your email. For all you know, they could have deleted the email a fraction of a second after that image downloaded.
Focus on these instead:
- Click-through rate
- On-site metrics for those who click through (sales, leads, conversion rates)
Hopefully, your goal in sending your email is to get your list members to do something. If this is the case, you're likely using some kind of call-to-action (CTA) that users can click to take them to your website.
Measuring clicks on your email's CTA gives you an idea of how many people in your list are engaging with your content to the point of taking a meaningful action. Most marketers do this by measuring click-through rate, or the percentage of recipients that click through on one ore more links embedded in the email.
You can take this concept a step further by also measuring actions users take after they get to your website
Key stat: Open rates wrongly predict email marketing campaign success 53% of the time.
Social Media Vanity Metrics
4. Like/Follower Count
Consider the following scenario:
Company A has 5,000 Facebook Likes, and Company B has 3,000 Facebook Likes. Conventional wisdom suggests Company A is doing better than company B, right?
But what if I told you Company B's Likes click or interact with a post an average of three times per month, while the same is true for Company A's Likes once per month.
This means despite having a smaller audience, Company B is getting nearly twice as much engagement on its posts as company A.
Which company would you say is doing a better job on Facebook?
Focus on this instead:
- Engagement count (reactions, comments, shares, and post clicks)
Key stat: Facebook estimates about 5% of monthly active users are fake
5. Facebook post Reach
I do actually think Facebook post reach a more useful metric than most of the other vanity metrics I've listed here, because Facebook will generally show your best content to more people.
But here's the rub: Facebook uses thousands of factors when determining what goes where on its users' News Feeds. This makes it hard to know exactly why one post might have reached more people than another.
Additionally, Facebook is constantly tweaking its reach algorithm, which can lead to unpredictable rises and drops in reach.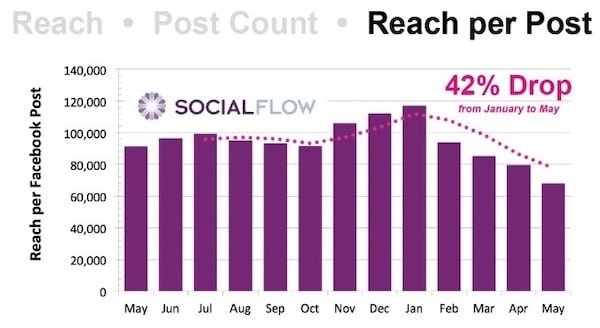
Source: Ad Week
The possibility of two posts of equal quality reaching different amounts of people is troubling.
Focus on this instead:
Engagement rate (the percent of people who saw the post that interacted with it)
No matter how many or few people see your post, measuring engagement rate (along with total engagements over time) will give you a better idea of individual post quality.
Key stat: Facebook reach dropped 42% in early 2016.
Takeaways
When determining which metrics to report, ask yourself the following questions:
- What business goals are related to this report?
- Do my metrics help inform business goals, or do they just paint a pretty picture?
- Are the metrics I'm reporting on illustrate quality and quantity, or just quantity?
If you're not currently generating leads or sales from your website but want to, download our guide to inbound marketing with SEO.

Topics: Strategic Analytics, Social Media Marketing & Management