As a B2B marketer, you know that your job contributes to the bottom line. The best B2B marketing campaigns generate qualified leads that can eventually be handed off to sales. Leads convert into customers, which result in sales revenue and profit.
But how do you optimize the effectiveness of your campaigns and demonstrate their value to the C-suite?
This is where KPIs come in.
What are B2B marketing KPIs?
Key performance indicator (KPI)—a metric used to measure the performance of an initiative
Key performance indicators are metrics, such as conversion rate or number of sales qualified leads, that help you evaluate whether you met your SMART goals and measure your progress toward those goals.
Key performance indicators vs metrics
While some metrics are KPIs, not all are. Key performance indicators are used to measure the performance of a specific initiative, such as the effectiveness of new content at generating leads.
"Metric," on the other hand, is a catch-all term for data that measure all kinds of things, like website visitor location and page exit rate, which may or may not be used to measure the performance of a given initiative.
What are SMART Goals?
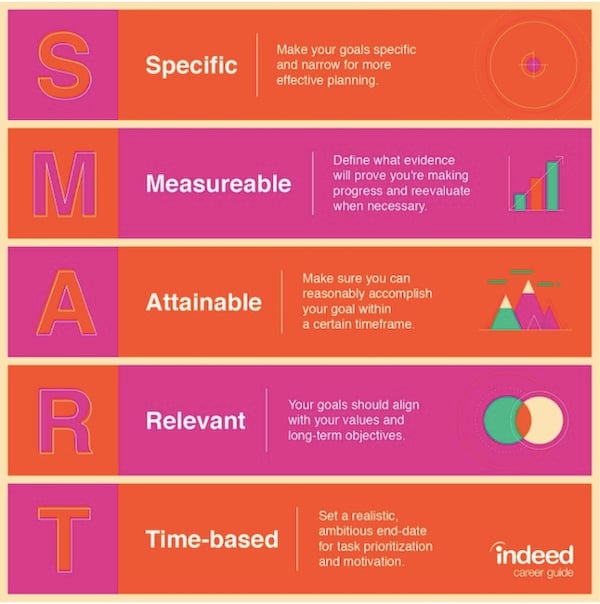
The “SMART” framework is a popular goal-setting method that helps ensure that your goals are realistic, tactical, and achievable.
 Source: Indeed
SMART stands for:
- Specific: Your goal is narrow enough that you are able to create a focused plan for achieving it.
- Measurable: You are able to use KPIs (metrics) to track your progress and determine whether or not you achieved your goal.
- Attainable: You can reasonably meet this goal within the time frame you have specified.
- Relevant: It aligns with your business’s needs and objectives.
- Time-based: You have defined a time frame for achieving this goal and have set a deadline.
Learn more about setting SMART goals.
Why track KPIs?
For every goal you set, you will want to use one or more KPIs to measure your initiative’s performance.
For example, if you want to generate 50 new leads per month from a particular piece of content, you might choose the KPI of landing page views to keep track of how many people reached the conversion page for that content.
Based on the number of views and conversions you have received after a week, you could also calculate the average conversion rate of your landing page (another KPI) which tells you what percentage of your landing page viewers (on average) convert into leads.
This data could be used to estimate how many views you would need to get in order to acquire 50 new leads. This could help you track your progress toward your goal over the course of the month.
Types of KPIS
Different types of KPIs help you measure different processes and aspects of your goal, or present information in different ways. According to BrightGauge, the 11 most common types of KPIs are:
- Quantitative indicators: provide numerical data, such as number of page views
- Qualitative indicators: provide qualitative data, such as customer feedback
- Leading indicators: predict the outcome of an initiative or performance of a company, such as % of growth in sales pipeline
- Lagging indicators: measure the results of an initiative or performance of a business, such as annual net income
- Input indicators: "measure the resources used during the initiative," such as hours spent
- Process indicators: gauge the efficiency of a process, such as customer support tickets resolved
- Output indicators: evaluate whether the goal was or wasn’t reached, such as new customers acquired
- Practical indicators: gauge the effectiveness of a process, specific to your company’s processes
- Directional indicators: measure trends, such as whether a metric is improving, declining, or stable; for instance, whether your ROI is growing or shrinking
- Actionable indicators: measure how well a business is able to implement an initiative within deadlines
- Financial indicators: measure stability and growth, such as liquidity
How to choose the right KPIs
There is no uniform answer for how to select the correct KPIs, but here are some tips that should be relevant for most any goal.
Choose KPIs that are directly relevant to your goal
Ask yourself which KPIs can help you measure progress toward your goal, and which KPIs can help you determine whether or not you achieved the goal.
Let’s go back to the example goal of generating 50 new leads from your new piece of content per month. Let’s say that you decided to advertise that content with Facebook ads which ran for the whole month.
A KPI that could be useful for measuring goal progress might be the number of clicks your ads received.
A KPI that could determine whether you achieved the goal might be Facebook-driven lead volume, or how many leads you received as a result of your Facebook ads.
Measure both qualitative and quantitative KPIs
Quantitative KPIs, such as the number of customers acquired, provide hard, objective data. Qualitative KPIs, such as positive customer reviews, provide qualitative, subjective information. Both provide valuable insights into your performance.
Quantitative KPIs can tell you what happened, while qualitative KPIs can help you learn why something happened.
For example, let’s say you update your “get a quote” page. After three months, you notice you’ve received dramatically fewer form submissions (a quantitative KPI) since you updated the page, and people abandon it after a few seconds (another quantitative KPI).
So you perform a user test. Many of the test subjects say they do not like the length of your form (a qualitative KPI). You shorten the form dramatically and within a month see a rise in submissions.
It’s a good idea to measure both qualitative and quantitative KPIs so you can piece together the whole story and diagnose problems.
Measure both leading and lagging KPIs
Leading KPIs help you forecast the results of an initiative while lagging KPIs tell you how well it actually worked. It’s best to use both.
One will help you set realistic expectations and make adjustments during your campaign, while the other will help you identify what did and didn’t work.
For example, let’s say that your goal is to generate $2,000 in revenue from leads acquired via a 30-day LinkedIn campaign. A useful leading KPI to use in this case would be expected lead value (the estimated revenue value of your leads), because it allows you to use data you already have during your campaign to help you estimate whether or not you're on track to meet your goal. It can be calculated this way:
Average customer lifetime value x average lead-to-customer conversion rate x Number of leads generated by your campaign = expected lead value
If your average customer lifetime value is $1,000, your lead-to-customer conversion rate is 10%, and the number of leads generated by your campaign to date is 50, then:
$1,000 x 10% x 50 = $5,000 expected lead value
Leading KPIs can help you make informed decisions that may improve the outcome of your campaign, such as how much you should invest or how long it should run.
In this case, your lagging indicator would be campaign-assisted revenue generated. Once the campaign is concluded and the leads it generated have finished making their way through your company's sales cycle, you can use CRM or accounting data to calculate how much actual revenue those leads produced. This data can then be used to inform leading indicators for future campaigns.
Helpful KPIs for different campaign types
While this list is by no means exhaustive, it includes all the KPIs we regularly track for clients, which are useful for a range of B2B businesses.
General B2B marketing KPIs
Expected lead value (in revenue)
Expected lead value allows you to forecast revenue from a set of leads using data you already have. According to AdStage, expected lead value can be calculated this way:
Average customer lifetime value x lead-to-customer conversion rate = expected lead value (on a per-lead basis).
So if:
- your average customer lifetime value is $10,000
- 10% of MQLs become customers
- 25% of SQLs become customers
Then:
- MQLs are worth $1,000 to your business
- SQLs are worth $2,500 to your business
Web-generated revenue
This KPI measures how much revenue within a set time period can be attributed to digital marketing campaigns, such as paid search advertising, website form submissions, and content marketing.
This helps businesses determine the return they're getting from their digital marketing investment.
Google Ads & social advertising KPIs
Advertising campaign ROI report
This KPI helps you compare the cost of your advertising campaign to the revenue it generated.
For example, if you spent $1,000 on Google search ads in a month, and those searches resulted in $4,500 in revenue, your advertising campaign ROI is 4.5.
Especially if your business has a long sales cycle, you can also plug in expected lead value into this equation to calculate expected ROI.
So if that $1,000 Google Ads campaign produced three SQLs and you know SQLs are worth $2,500 to your business, your expected advertising campaign ROI is 7.5.
Ad leads generated
This KPI represents the total number of leads generated by a paid advertising campaign.
MQLs/SQLs generated by advertising
These KPIs refer to the number of marketing-qualified and sales-qualified leads generated by advertising. The definition for MQL and SQL can vary from organization to organization, but those below reflect what we use in reporting for our own clients.
Marketing-qualified leads are potential customers who showed implicit interest in your business, typically by performing a high-funnel conversion action and viewing a product or service page.
Sales-qualified leads are potential customers who showed explicit interest in your business, metaphorically raising their hand for a sales follow-up. Often SQLs convert by submitting a "Contact Us" form or calling the phone number from your sales team from your website
These metrics are useful for making projections about who will turn into customers, and more generally, assessing whether or not your marketing is producing leads that are actually valuable.
Phone calls from ads
This KPI measures the number of leads that called you either directly from an ad (Google Ads, for example, sometimes include phone numbers) or from your website after clicking on an ad.
B2B website KPIs
Source/medium reports
This KPI refers to reports in Google Analytics and most other website analytics platforms that show you where visitors to your site came from. A source refers to the name of the specific channel that drove a user to your site, and medium refers to the broader channel that Source is a part of.
For example, if they found your site via a Google Search, their Source/Medium would be Google (the name of the search engine)/Organic (meaning unpaid search).
These reports help you to track which channels are driving traffic, site conversions, and revenue.
Website-generated leads
This KPI measures how many leads converted on your website. An easy way to measure this is to track and count form submissions, such as your contact-us form.
Top pages viewed by customers/leads/MQLs/SQLs
These KPIs refer to the pages on your site that were most viewed by customers and different types of leads.
If you have a large database of customers, it might be best to track your customers exclusively, since they have already made a purchase.
However, if you don’t have a large number of customers already, then you can also track the pages viewed by (ideally) qualified leads, or just leads generally.
Tracking these metrics can help you to monitor the steps your leads take toward becoming customers.
Ecommerce revenue
This KPI measures revenue from your online store, which is helpful for tracking your return on ecommerce investments.
B2B content marketing KPIs
Content leads generated
This KPI represents the total number of leads generated by content.
One way is track this is to identify how many contacts entered your site for the first time through a piece of content. If you care more about the content that converts visitors to leads, you could also track the content offers claimed by leads, or pages viewed immediately before conversion.
MQLs/SQLs generated by content
These KPIs refer to the number of marketing-qualified and sales-qualified leads generated by content.
Content-influenced qualified leads
This KPI measures how many leads, MQLs, SQLs, and/or Opportunities viewed your content at some point before converting.
You can measure this by filtering your reports to include visitors or leads that both:
- a given URL or URL segment
- went on to become a lead/MQL/SQL/Opportunity
For example, if all of your blog post addresses contain "/blog," you could filter sessions that included at least one page view including that URL segment and later went on to convert.
This is a helpful report used to quantify the performance of content that may not have attracted visitors in the first place, but could still be influencing their behavior.
B2B marketing-to-sales KPIs
Lead-to-customer conversion rate (sales conversion rate)
This KPI represents the percentage of a company’s qualified leads result in closed-won deals. According to the Corporate Finance Institute, it can be calculated this way:
Lead-to-customer conversion rate = number of qualified leads that resulted in sales / total number qualified leads x 100
For example, if 100 of your qualified leads in a given timeframe became customers and 1,000 total qualified leads were generated during this timeframe, then your lead-to-customer conversion rate is 10%.
This metric helps B2Bs get an idea of how many qualified leads they need to generate in order to generate a customer.
Customers acquired
This KPI represents the number of paying customers you acquired within a given time frame. If possible, it may make sense to refine this KPI to only include marketing-assisted customers acquired (i.e. number of customers with one or more marketing touches prior to becoming customers).
Lifecycle stage progress report
This KPI refers to a report that shows contacts’ progress toward becoming a customer.
This progress report helps you track how many people are in each stage at a given time, and can help you see how many leads you have successfully converted into customers after being in a given lifecycle stage.
Email KPIs
Email clicks
This KPI measures how many recipients click a link from your email.
This can tell you how good a job you're doing at writing enticing email copy.
Email replies
This KPI measures how many recipients reply to your emails. This is useful because it measures interest and engagement.
How to track KPIs
There is a whole world of marketing software out there to help you achieve your goals. But here are a few tools that we use to track KPIs:
- Google Analytics: free, industry-standard analytics software
- Google Search Console: free, industry-standard software for tracking the performance of your pages in Google search results
- Google Ads / Meta (Facebook) Business Suite / LinkedIn Campaign Manager: If you're running Google, Facebook, or LinkedIn ad campaigns, you can track KPIs from within their campaign management platforms, or pull data (manually or via an API connection to a different piece of software) and combine it with other marketing or sales data when reporting on KPIs.
- HubSpot: this all-in-one Marketing, Sales, and Service platform is useful for tracking performance throughout and beyond the funnel and allows for creating custom dashboards where users can view KPI reports in real time. We recommend it to most of our B2B clients.
Conclusion
Choosing the right KPIs for your B2B’s marketing goals can help you stay on track, evaluate your progress, and make more informed decisions. At the end of the day, it can also provide quantitative evidence of a job well done to share with your coworkers and superiors.
Topics: Strategic Analytics